Backing every data point in this analysis is a rare disease that affects the daily life of one or many more patients worldwide. The data used for preparing this analysis can be found in the Orphanet Scientific Knowledge Files. These knowledge files are a cluster of databases that contain the most complete open access information of known rare diseases [1]. The processing of the data is described at the end of this post.
Throughout this post I am going to refer to a Decentralized Science Ecosystem as a conceptual solution to rapidly deploying genetic medicine into ultra-rare diseases. Decentralized Science refers to a collaborative and distributed approach to research and innovation, where individuals and smaller groups autonomously contribute to scientific advancements outside traditional centralized structures. It emphasizes open access, peer-to-peer collaboration, and the use of emerging technologies to foster a more inclusive and agile scientific ecosystem [Chat GPT]. In contrast to traditional structures in drug development, Decentralized Science may also provide a refreshing alternative vibe, particularly for the scientists who work within it.

An Endless Forest
My first impressions of the Orphanet data are from the overwhelming number of rare diseases there actually are. This data set contains only 3,200 rare genetic diseases, less than half of the contemporary estimates from 8,000 to 10,000+ unique rare diseases. Figure 1 plots each rare disease by an estimate for the combined number of patients in the USA and European Union (x-axis). The y-axis is just random jitter for visibility.

Figure 1. 3,200 rare genetic diseases plotted by patient prevalence and with colors indicating which have a FDA approved Gene Therapy. Drug developers are challenged in finding an economically sustainable business model to move into the orders-of-magnitude smaller patient populations.
I have colored the diseases for which the FDA has approved a gene therapy [2]. The most recent gene therapy approvals have been for the less rare indications that affect patient populations on the order of 10,000s. The genuine upside of this observation is that thousands of people will benefit from these innovative medicines. A likely downside is that this level of value potential can set the baseline expectation for company growth and investor ROI. Sustaining these financial metrics by commercializing several, maybe dozens, of gene therapies for the many more diseases that impact only 10s, 100s, or 1000s of patients will be a heavy lift.
Paradoxically, a centralized business model in pursuit of ultra-rare diseases would need to grow all business units at an inverse proportion to the revenue potential of rarer indications. Any bottleneck in research or supply chain will throttle the potential to rapidly commercialize the volume of low demand therapies required to match the revenue potential of a single high demand therapy. Enabling this will require strict standardization to enable sophisticated automation systems and a disciplined coordination of operations. These capabilities come with expensive overhead and concessions in the flexibility needed to customize to the diversity of ultra-rare diseases.
Seeing the Forest for the Trees
An alternative Decentralized Science ecosystem would look and feel quite different; both from the outside economist and the inside scientific contributor. While a centralized business model might attempt to maximize value by protecting a monopoly on innovation, a decentralized business model would maximize the benefit of innovation by getting into the hands of as many researchers as possible. Let’s walk through an example.
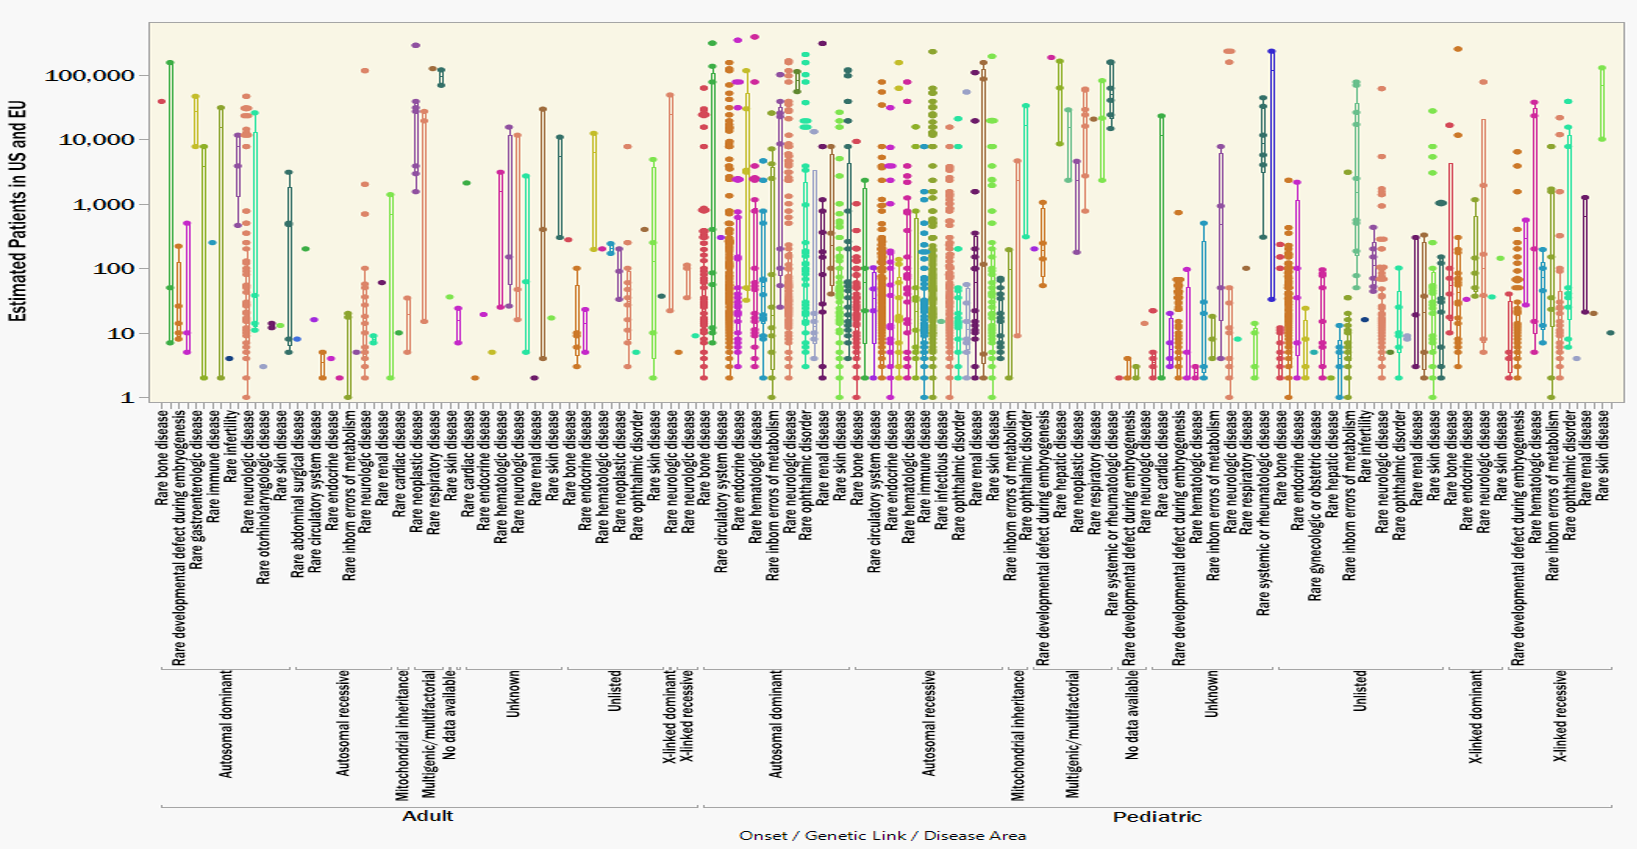
Figure 2 illustrates the previously shown data, now clustered according to disease area, genetic linkage, and age-of-onset. Clustering the rare diseases according to root commonalities foreshadows how a single innovation could be reapplied to multiple related indications. It’s possible, and maybe even necessary, that a breakthrough in treating (for example) a pediatric, autosomal recessive, metabolic disease provides invaluable insights to treating the other 224 identically classified indications. Similarly, a hypothetical breakthrough in treating a pediatric, autosomal dominant, neurologic disease could pave the way to treating another 157 other conditions; and so on down the list.
Figure 2. 3,200 rare genetic diseases clustered according to disease area, genetic link and age of onset. Strategies for splitting development costs over entire disease categories would distribute the cost burden over a larger volume of patients.
Now, hypothetically we decentralize the follow-on development to treat the hundreds of additional indications. A Decentralized Science ecosystem would favor many smaller and more autonomous research centers applying the same breakthrough innovation over an entire disease category.
From an outside perspective, “smaller” can mean less investment is required for scaling non-scientific overhead. This contributes to a more attractive risk adjusted price-to-sales ratio when going after niche ultra-rare indications. Furthermore, “autonomous” can ideally mean incentives other than the opportunity costs in profit and growth can guide decisions for which indications are worth pursuing.
A scientific contributor on the inside of a Decentralized Science ecosystem could experience a closer connection to their scientific work and the community supporting them. Trading non-scientific overhead for greater autonomy means less bureaucracy with fewer distractions from the core research. Exchanging your relationship to unaffiliated peers from competition to collaborators expands your access to knowledge and your potential to make tangible contributions. For many, this environment may contribute to a more fulfilling career journey.
No Time like the Present
2023 was considered a breakout year with seven new FDA approvals for cell and gene therapies [2]. While even more approvals are expected in 2024 and beyond, there will still be an urgent and unprecedented need to rapidly accelerate this success. Even if the pharma industry can reach a steady state at 10 times (70) as many annual approvals for ultra-rare diseases via all modalities, we would still only cover less than 10% of the known rare diseases over the course of a decade.
To further illustrate this point, I sorted the Orphanet data by decreasing level of prevalence and overlaid with progress bars representing 10 years of new approvals. Figure 3 assumes a very utilitarian strategy of starting with the most prevalent diseases first and working toward the ultra- rare indications over time. Even at an unimaginably accelerated pace, a decade of progress still leaves behind millions of patients worldwide.

Figure 3. 3,200 rare diseases in decreasing prevalence overlaid with hypothetical 10 year progress bars labeled with target annual new gene therapy approvals. A collaborative Decentralized Science ecosystem could supplement the limited productivity of the pharma industry; treating more patients who might otherwise not benefit from innovation in genetic medicine.
Now imagine yourself contributing to a Decentralized Science ecosystem dedicated to eradicating untreatable ultra-rare genetic disease. Starting at diseases with 1000 or fewer patients, you would be contributing to a portfolio of life changing medicines not limited by the prerequisite of financially sustaining large corporate profits. Your daily work would be in making artisan contributions to niche innovative medicines rather than turning a crank in highly automated industrial machine. Moreover, to the patients who benefit from treatments that may have otherwise never been developed, your contribution would mean everything.
Anyone can be a decentralized scientist
Figure 4 summarizes and scores the functional impact of various rare diseases (scoring by frequency and severity described below). More telling than the data shown is what is missing. Only 266 of the 3,200 rare genetic diseases included in Figures 1-3 have functional impacts in the Orphanet Database. The available data is also heavily weighted toward the more prevalent diseases. While diseases with more than 1000 patients make up only 10% of the whole dataset, they make up 60% of the diseases for which functional impact data is recorded.

Figure 4. Functional Impact Severity Score (higher score indicates a more severe and sustained negative impact) for only 266 out of 3,200 rare genetic diseases. While we have identified 1000s of ultra-rare diseases, we don’t know so much about many of them. A more complete understanding of functional impact will help to prioritize research efforts as well as aid in designing more meaningful clinical trials.
This observation is demonstrative of a lack of understanding of ultra-rare diseases. Lacking an understanding of disease progression contributes to the challenge of defining success metrics for clinical trials. Documentation of disease progression, through Natural History Studies, sets a baseline for clinical trial design. The safety and effectiveness of a novel therapeutic can then be clinically measured against the expected progression of the patient’s disease.
You do not need a STEM degree or higher education to provide a meaningful contribution to a decentralized Natural History Study. I suspect a degree in speech and language could prepare one to objectively assess a patient’s ability to communicate. Lived experience working in service or hospitality may also give insights to the level of life skills required to contribute meaningfully in those sectors. If you can learn to collect real world data in a controlled and structured way, you too can fill a niche in the Decentralized Science ecosystem. Connecting with patients in your community, building trust, and giving confidence that people are trying to help.
Curating the ecosystem
A future where Decentralized Science plays a critical role in curing ultra-rare diseases may be less hypothetical than one might think. There are already many courageous individuals who have dedicated their professional lives to curing the rarest of diseases; I follow many on LinkedIn. There are also emerging collaborations dedicated to sharing resources and intellectual property for the purposes of novel gene therapy development; I’m supporting two. To pull it all together, Decentralized Science startups and communities are designing innovative tools to enable this ecosystem to flourish. Who is going to cure 3,200 rare diseases? It’s going to take all of us!
Processing The Orphanet Database
The data used in this posting can be found on orphadata.com. The information contained in the Scientific Knowledge Files is widely recognized and cited for discussions on the vast scope of rare diseases. The data on orphadata.com is divided into several different files that required piecing together. Although the data included in these knowledge files is extensive, it is incomplete in that not every rare disease is exhaustively described. To offset this “incompleteness”, clustering of parameters to reduce dimensionality was rationally applied. Please understand (and forgive) this tradeoff of nuance for simplicity in the data processing and visualization.
The data used for this posting was extracted from:
- Epidemiology of Rare Diseases – Combined Prevalence Data
- Linearization of Rare Diseases – Disease Area
- Natural History of Rare Diseases – Age of Onset and Genetic Linkage
- Rare Diseases and Functional Consequences – Life Skills, Motor Skills, Cognition and Communication
Many of the conditions included in the databases are not diseases (ex. malformations) or not linked to any genetic anomalies (ex. infections, cancers). I followed the methods in Wakap 2020 [3] to filter out data not relevant for these analyses.
Patient prevalence estimates were often given for more than one geographical region. For the purposes of selecting a single prevalence estimate, the hierarchy of prevalence information was chosen based on the abundance of data points and was as follows:
Worldwide > Europe > United States > United Kingdom > Germany > France > Italy > Spain > Netherlands > Sweden
Quantitative patient prevalence was also given by various counts (cases, families) or statistics (point, birth, annual, lifetime). Most of the ultra-rare diseases are listed by number of known cases where as more prevalent diseases are given by a statistic. A single estimate for the number of patients in the USA and EU (Combined Population 770M) was taken according to the following hierarchy:
Case > 5x Family > Point > 5x Birth Rate > Annual > Lifetime
I chose to scale patient prevalence by combined US and EU population rather than to the worldwide population. Extrapolating prevalence data to the global population could be inappropriate due to regional diversity in genetic epidemiology. It would also be ignorant of the fact that most gene therapies are unfortunately not accessible today outside the major economies of North America and Europe.
The data contains 128 different functional consequences that were qualitatively described by frequency, duration, and severity for one or more rare disease. To condense this information I categorized each consequence as impacting either:
Life Skills, Motor Skills, Cognition and Communication.
I converted the qualitative metrics into a quantitative scale and multiplied the three values to calculate a severity as shown in Figure 4 and Table 1 below.

Table 1. Scoring matrix and formula for calculating Functional Impact Severity Scores assigned to rare diseases included in Figure 4.
All the Orphanet Scientific Knowledge Files are free to use under Commons Attribution 4.0 International License. There is a lot more information than what I sorted through and discussed. I can only encourage anyone interested in learning more about rare diseases to go check out the great resource Orphanet offers at orphadata.com.
References
- Orphanet Scientific Knowledge Files. December 2023.
https://www.orphadata.com/orphanet-scientific-knowledge-files/ - Approved Cellular and Gene Therapy Products. December 2023.
https://www.fda.gov/vaccines-blood-biologics/cellular-gene-therapy-products/approved-cellular-and-gene-therapy-products - Wakap SN, Lambert DM, Olry A, Rodwell C, Gueydan C, Lanneau V, Murphy D, Le Cam Y, Rath A. Estimating cumulative point prevalence of rare diseases: analysis of the Orphanet database. Eur J Hum Genet. 2020 Feb;28(2):165-173
https://pubmed.ncbi.nlm.nih.gov/31527858/

